• Platform
    • Overview
      • Risk Cloud Overview
      • Features
      • Services & Support
      • Pricing
    • Capabilities
      • Reporting & Analytics
      • Risk Quantificaton
      • Integrations & API
      • Risk Cloud Exchange
      • Platform Security
    • img
      See why Risk Cloud was rated the #1 GRC platform on the G2 Grid for Winter 2023.
      Learn more
  • Solutions
    • _separator
      • Cyber Risk & Controls Compliance
      • Enterprise Risk Management
      • Third-Party Risk Management
      • Controls Compliance
      • Policy Management
    • _separator
      • Regulatory Compliance
      • Data Privacy
      • Operational Resiliency
      • Environmental, Social & Governance
      • Internal Audit
    • 10 Purpose-Built GRC Solutions. One Connected Platform.
      View All Solutions
  • Industries
    • _separator
      • Industries Overview
      • Software
      • FinTech
      • Telecom
      • Banking
    • _separator
      • Insurance
      • Investment Services
      • Hospitals & Health Systems
      • Pharmaceuticals
      • Medical Devices
    • _separator
      • Oil & Gas
      • Utilities
      • Alternative Energy
  • Company
    • _separator
      • Our Company
      • Careers
      • Executive Team
      • Partners
    • _separator
      • LogicGate News
      • LogicGate Trust Center
      • Contact Us
    • img
      The Root of the Compliance vs Security Paradox
      Upcoming Webinar
      Register Now
  • Resources
    • Risk Cloud Help
      • Help Center
      • Developer Portal
    • Learn + Connect
      • Blog
      • Customer Stories
      • LogicGate Resources
      • LogicGate Events
      • GRC & Me Podcast
    • img
      Five Board Questions That Security and Risk Leaders Must Be Prepared to Answer
      View Report
Request A Demo
img
See why Risk Cloud was rated the #1 GRC platform on the G2 Grid for Winter 2023.
Learn more

Documentation

Menu

  • Quick Start Guides
    • Risk Cloud API: Getting Started
    • Risk Cloud PowerBI Connection
    • Risk Cloud Webhooks
  • API Usage Guides
    • Risk Cloud API: Pagination
    • Risk Cloud API: Record Search
    • Risk Cloud API: Authentication
    • Risk Cloud API: Create Records
    • Risk Cloud API: Export Record Data
    • Risk Cloud API: Update Records
    • Risk Cloud API: Upload Attachments
    • Risk Cloud API: View User Access Audits
    • Risk Cloud API: View Applications, Workflows, and Steps
    • Risk Cloud API: Viewing Fields
    • Risk Cloud API: Viewing Users
    • Risk Cloud API: Create Users
  • Release Notes
    • v2021.4.0 Release Notes
    • v2021.3.0 Release Notes
    • v2021.2.0 Release Notes
    • v2021.1.0 Release Notes
  • Developer Blogs
    • Tidying Up Existing REST APIs
    • Accessibility Improvements at LogicGate
    • What Do We Look for in Developers?
    • 2 Quick Tips I’ve learned for FE Testing as a LogicGate Dev
    • Kotlin at LogicGate
    • Spring Boot with Neo4j & MySQL
  • Case Studies
  • Integrations
    • Vital4 Risk Cloud Connector
    • Ascent Risk Cloud Connector
    • SecurityScorecard Risk Cloud Connector
    • Tenable Risk Cloud Connector
    • Black Kite Risk Cloud Connector
  • Home
  • Developer Resources
  • Developer Blogs

2 Quick Tips I’ve learned for FE Testing as a LogicGate Dev

By: Kat Kodes | Updated on: May 27, 2020

Debugging is an essential part of writing code. During my time here at LogicGate I’ve learned a ton of helpful tips and tricks (big shout out to my teammates!) that make debugging on the Frontend more efficient. Below, I share two of my favorite debugging tips that have saved me time and headache.

Tip #1: Run a Single Test in Jasmine

We have almost 800 Frontend unit tests for our code base. You can imagine not wanting to have to run the entire test suite when adding a new test or updating an existing one. Luckily we use Jasmine and the library has a pretty simple — but not obvious — way to handle this.

The solution here? A simple f ! That is correct, all you need to do is put an f in front of a describe or it block.

Here’s a block of test code:

describe('Component: Table Report', () => {
 
  it('should render', () => {
    expect(component).toBeDefined();
  });
});

To run the entire block, you would just use fdescribe :

fdescribe('Component: Table Report', () => {
 
  it('should render', () => {
    expect(component).toBeDefined();
  });
});

To run an it block individually you can also use fit:

describe('Component: Table Report', () => {
 
  fit('should render', () => {
    expect(component).toBeDefined();
  });
});

Simple, right? One caveat here is that if you run a single test this way, it is easy to forget to remove the f from your code. The dev team at LogicGate has handled this by creating a linting rule that disallows fdescribe and fit as function names, and running our linter as part of our CI pipeline.

Tip #2: Add Breakpoints Using Chrome Dev Tools

(Note: I am using Google Chrome in all of the following screenshots. Other browsers may have similar functionality, but for the purpose of this blog I will only discuss Chrome.)

While our reliable friend console.log will always be there when we need them, adding breakpoints adds more debugging functionality and access. I’ve used debugger statements in my code to trigger a breakpoint using Chrome + Chrome Dev Tools in the past, but a fellow teammate showed me an easy way to add them directly in the browser.

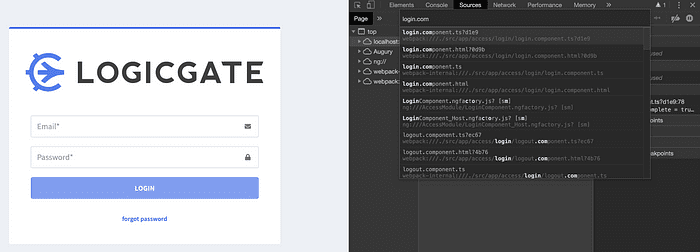
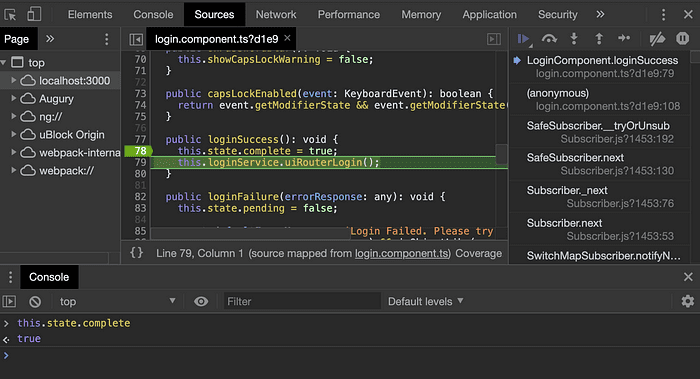
To find the source file you want to place a breakpoint in, using the file name, open Chrome Dev Tools and go to the Sources tab.

Screenshot of the chrome dev tools shelf with the Source tab (third tab) selected

From the Sources tab, use cmd + p on a mac or ctrl + p on a PC to open the file name search bar to then search for your file.

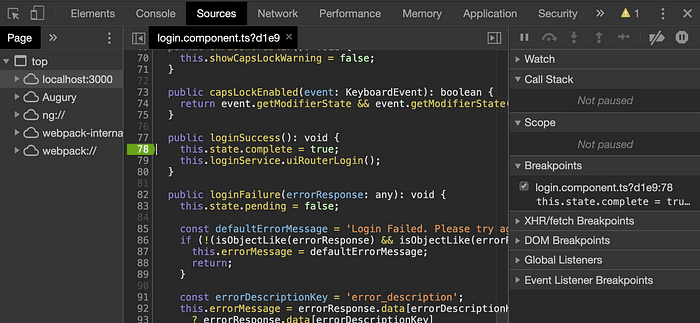
Once you’re in the file you want to place a breakpoint in, you can search within the file using cmd + f or ctrl + f . Place your breakpoint in the left column which shows the line numbers.

Next, interact with the the app in your browser to trigger the break point!

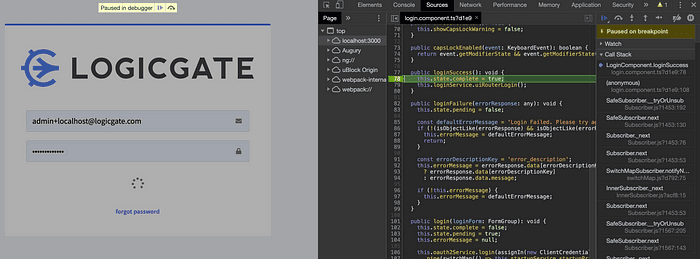
Once you hit the breakpoint, you’ll have access to any variables in the scope of the break point, and you can click through the steps of your code.

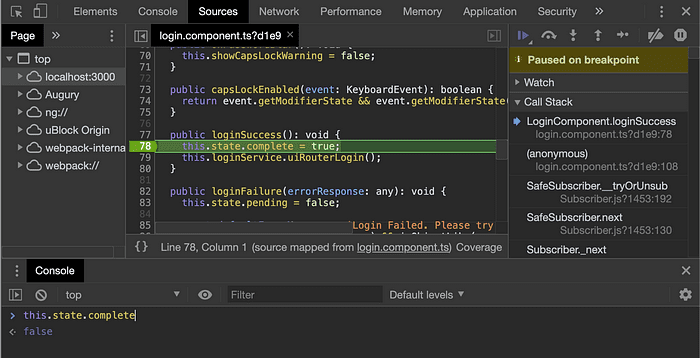
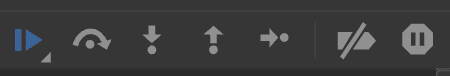
You can use the toolbar on the right to walk through code, play through your breakpoint, or disable breakpoints.

These are just a couple of the techniques I’ve learned from my fellow developers at LogicGate. Hopefully you found this useful and learned something new!

Wishing you the best on your testing endeavors.

Read Previous Developer Blogs
Read Next Developer Blogs
  • 320 W Ohio St
    Floor 5E
    Chicago, IL 60654
  • 312-279-2775
    • LinkedIn
    • Twitter
    • Youtube
    • Facebook
  • Looking for something specific?
  • Request A Demo
  • Platform
    • Risk Cloud Overview
    • Features
    • Reporting & Analytics
    • Risk Quantification
    • Integrations & API
    • Risk Cloud Exchange
    • Services & Support
    • Pricing
  • Company
    • Careers We're hiring!
    • Executive Team
    • Partners
    • LogicGate News
    • LogicGate Trust Center
    • Contact Us
  • Resources
    • Blog
    • Email Newsletter
    • Resource Center
    • Help Center
    • Developer
  • Solutions
    • Cyber Risk & Controls Compliance
    • Enterprise Risk Management
    • Third-Party Risk Management
    • Controls Compliance
    • Regulatory Compliance
    • Data Privacy Management
    • Operational Resiliency
    • Policy Management
    • Environmental, Social & Governance
    • Internal Audit Management
    • View All Solutions
  • Industries
    • Software
    • FinTech
    • Telecom
    • Banking
    • Insurance
    • Investment Services
    • Healthcare
    • Pharmaceuticals
    • Medical Devices
    • Oil & Gas
    • Utilities
    • Alternative Energy
Also of Interest
  • Connect, Optimize, and Scale Your Cyber Risk...
  • Data Privacy Software Solution
  • Grow Your Relationships Not Your Risks.
  • LinkedIn TwitterYoutubeFacebook

Copyright © 2023. LogicGate, Inc. All rights reserved.

  • Privacy Policy
  • Information Security Overview
  • Site Map

Copyright © 2023. LogicGate, Inc. All rights reserved.