How Risk Cloud Helps You Streamline Reporting and Gain Visibility

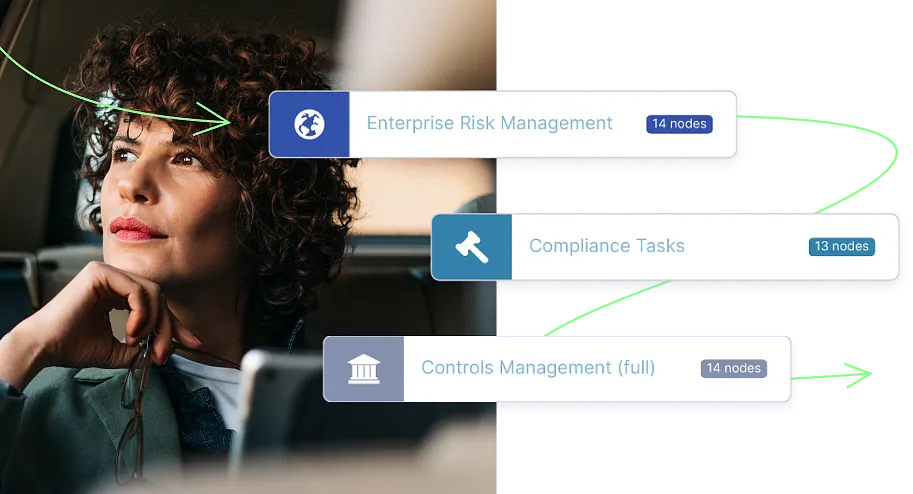
Connect Risk to Business Impact
Improve data integrity and visibility across the enterprise by connecting the right people with the right information. You’ll have the ability to create role-based dashboards tailored to how teams work best without costly change requests or writing a single line of code.
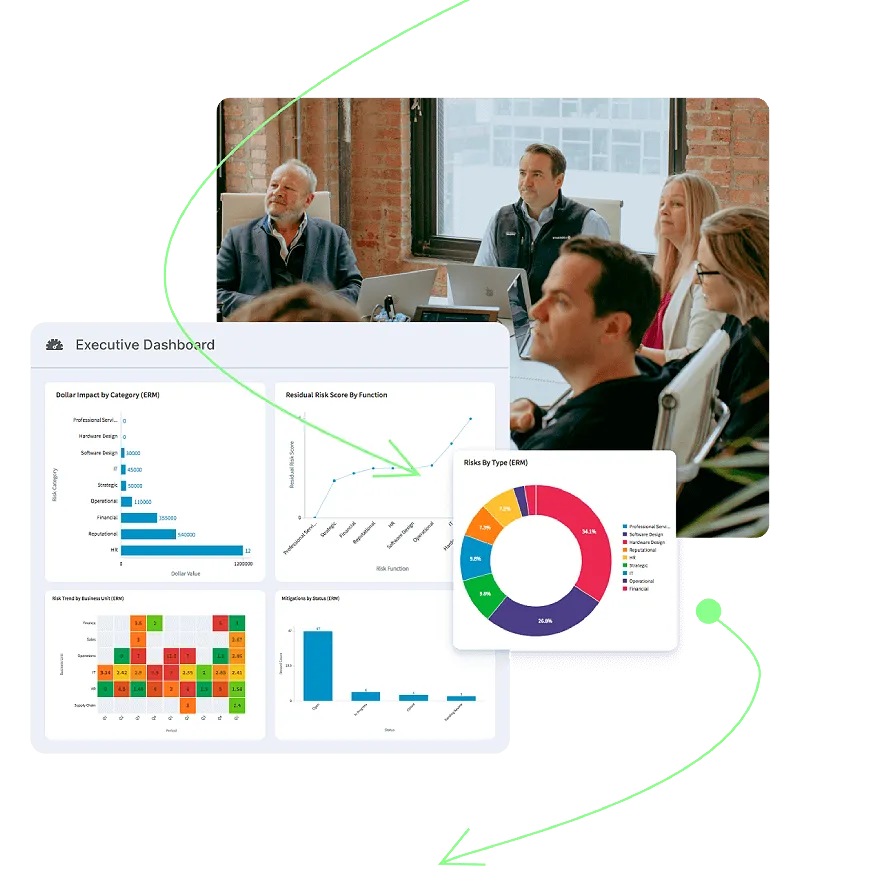
Simplify Executive Reporting
Easily communicate strategic investment opportunities with the help of reports that aggregate data across business units and identify critical trends in near real-time. Further streamline executive reporting with AI-generated summaries of your organization's most critical risks and recommended mitigations.
Save Time with Automation
Stop manually sourcing and analyzing data from disparate processes across your organization with continuously updated and centralized reporting. Then, leverage Risk Cloud Documents™ to rapidly generate data-driven presentations summarizing the latest program insights.
Uncover Trends in a Single Click
Discover developing trends with risk insights across your entire organization. Because Risk Cloud centralizes and dynamically links all your risk, control, and assessment findings, you can drill deeper into any risk metric without leaving the platform.
Integrate Data Across Your Tech Stack
Create a single source of truth across business units and your existing GRC tech stack. Push or pull important risk data to and from Risk Cloud with out-of-the-box or fully custom integrations. Then, aggregate the latest insights into your preferred data visualizations like table, line, bar, pie, scatter, and heatmap charts.
Quantify the Financial Impact of Risk
Go beyond qualitative risk assessments by communicating the business impact of risk in a language every stakeholder understands – money. Risk Cloud Quantify® enhances traditional quantification techniques with Monte Carlo simulations and supports the Open FAIR™ Model.