19 Quarters at the Top: Risk Cloud Named a Leader on G2 for Spring 2024
Check Out the Spring 2024 Report
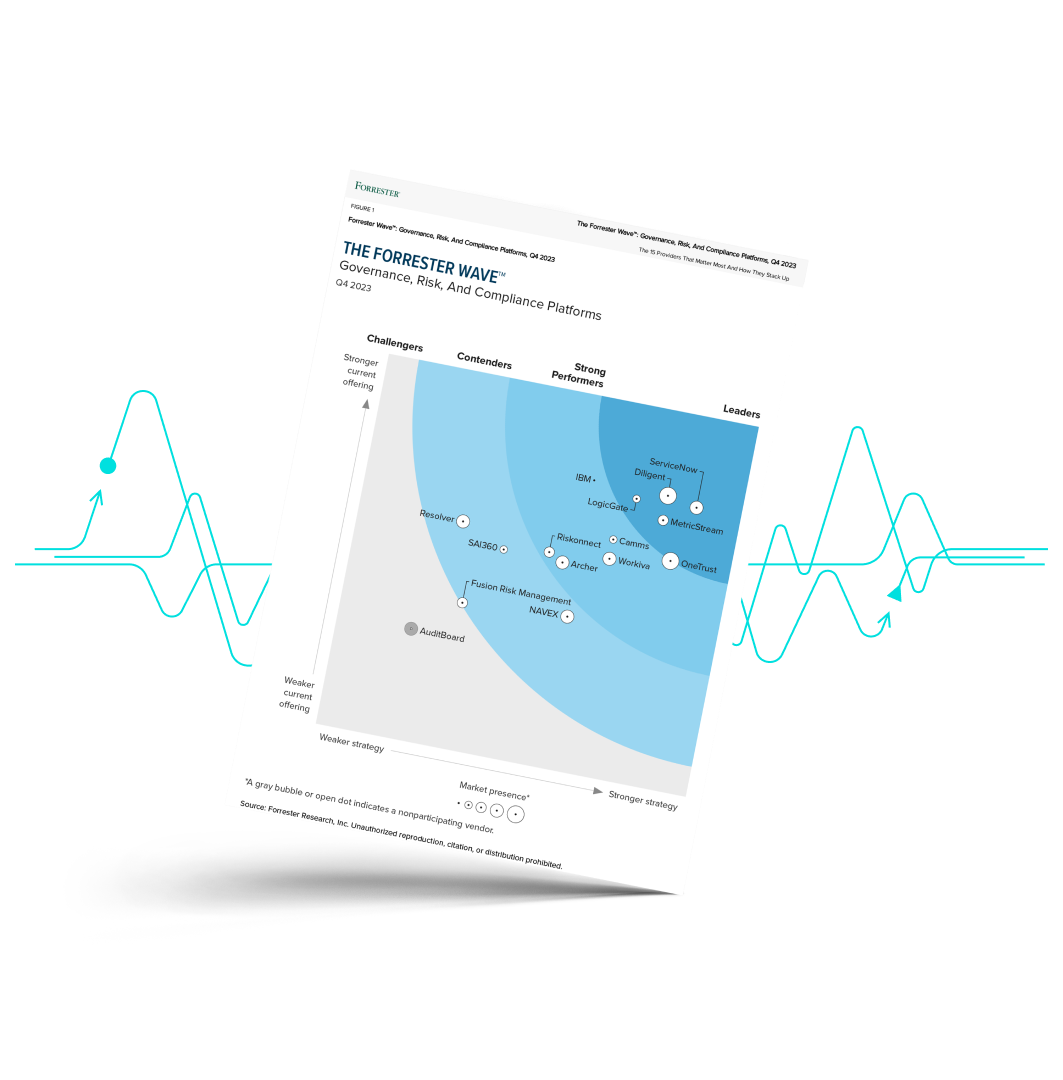
in The Forrester Wave™: Governance, Risk, And Compliance Platforms, Q4 2023

Link cyber threats to tangible business outcomes. Add context to any decision, prioritize remediation, and report what matters most to your key stakeholders.
Explore NowQuickly and easily assess and act on your organization's biggest risks with a clear view of connected risks and controls.
Explore Now

Efficiently measure third-party risk to improve your risk posture and expedite vendor onboarding processes.
Explore NowQuantify risk in financial terms and connect it to business impact to enhance your risk prioritization, planning, and response strategies.
Explore Now
- Josh H, Analyst, Vendor Management

- Tom S, Senior Information Security Analyst
- Paul H, VP of Business Continuity Management
- Andrew C, CFO

- Erin H, Corporate Compliance and Enterprise Risk Management Business Analyst
In March we hosted our annual Agility User Conference in Chicago gathering hundreds of Compliance, Cybersecurity and Risk…
As a GRC software company founded by practitioners for practitioners, we understand your GRC program needs more than…
To be the best company, we need the best people. The employees of LogicGate are our most valuable…